
Tuesday, September 30, 2014
Monday, September 29, 2014
Wednesday, September 24, 2014
Tuesday, September 23, 2014
ARNY - Augmented Reality NY (Request) SILLECK (JAB Silleck Lounge
7:00 PM - 9:30 PM ARNY - Augmented Reality NY (Request) SILLECK (JAB Silleck Lounge) (Multi-purpose Room)
Monday, September 22, 2014
vuforia - notes
Download Unity
Make a Vuforia account-
Download the Vuforia Unity extension.
now
-----------------
Make a new project in Unity-
file/new project
Projects tab
in the assets folder
import package/ custom package
select the vuforia plugin
delete the maint unity camera- from the hierarchy tab
In the assets folder-
go to Qualcom Augmented Reality Prefab folder.
Drag the AR camera into the project sceen /herarchy
-----------
test camera
in the inspector [right] there may be a warning
if your webcam is not supported
Webcan Behavior Script
projects/ assets/ editor / QCAR / webcam profiles
open it
add our webcam
get the name form the unity inspector-
<webcam devicName= "Integrated Webcam"
you can now test the webcam by hitting the play button in unity.
----------------
add a tracking marker
projects/ assets / Qualcom Augmented Reality / prefabs/
choose "image target"
drag it into the heighrarchy.
we currently have no database so
in the inspector window
click on "No targets defined" button
should link to a QC website
click on "create database"
give it a name - no spaces
choose the target type
once this is done u can load marker to see its tracking score
check the database- check box next to the icon-
then above it -
click the
download selected targets- button
a popup window appears-
choose Unity Editor and create it
save it
------------------------------------
now we have to import the database-
projects/
assets - right click
import package/ custom package
find where u downloaded it- add it
find the qualcom database we just made-
import-
located -- assets/ editor/ QCAR/
ImageTargetTexture /Newdatabase [or ur name]
---------------------
we need to add the target into our image target
behavior (script).
Inspector-
image target behavior (script)
"Data Set" choose the
click on "image target field"
add the new database.
choose the target you want
--------------------------------
test with a cube-
create the cube from the game object tab [very top]
create other / cube
add lights
create the cube from the game object tab [very top]
create other / directional light
------------------------------
Inspector-
we need to check
"Data Set Lead Behaviour (Script)"
click on the
"load data set New box"
now u can test!
unity vuforia plugin
https://developer.vuforia.com/resources/sdk/unity
https://developer.vuforia.com/user/register
General Overview of Marker Based Tracking
Marker Detection for Augmented Reality Applications
Posted by Corné den Otter on 2 April 2010
Tag(s): Hobbyprojecten, Open Source
[update] We received a lot of comments requesting for the source code. At the moment we are very busy, so unfortunately we haven't had the time to clean-up the marker detection code. Because this has already been the case for quite some time now, we have uploaded the code (under the GPL). You are free to download the code in the zip file at the end of this blog post.
The code is just a prototype: it is hardly optimized and needs a lot of clean-up (and better memory management ;-)). That said: it's yours to play around with. Good luck with it and enjoy![/update]
The code is just a prototype: it is hardly optimized and needs a lot of clean-up (and better memory management ;-)). That said: it's yours to play around with. Good luck with it and enjoy![/update]
At Infi we have something similar to Google's 20 Percent Factor. If you have a great idea or something you want to know more about, you can spend time on it during work hours. The subject we’re currently interested in is augmented reality.
We (Corné and Reinder) started with looking for existing AR frameworks and found one interesting open-source project: ARToolkit (plus). This toolkit is written in C/C++ but also ported to flash en used in many AR demos you can find on the internet.
Unfortunately, the algorithm used for the detection of markers in this toolkit has some downsides:
- It is not very fast.
- It is not very good in detecting markers having an edge or corner (partial) occluded.
- It is based on a thresholding algorithm, and therefore performs not very well under changing or not homogeneous lightning conditions.
There are some successors of ARToolkit, using edge based detection algorithms (like ARTag andStudierstube Tracker) but these are closed-source libraries.
In 2008, Martin Hirzer wrote ‘Marker Detection for Augmented Reality Applications’ [1], an article explaining an edge based marker-detection algorithm. We decided to implement this algorithm in C++.
At the moment our code is just a prototype. Eventually (after a cleanup) we will open source our implementation and/or donate it to the ARToolkit code base.
In this blog post we explain the implemented algorithm.
[update] At the end of this post you can find a video of the marker detection in action.
Algorithm
Step 1: Divide image in regions

First the image is divided in small regions of 40x40 pixels and each region is divided into horizontal and vertical scan lines 5 pixels apart.
The next 3 steps are executed apart inside these regions which boosts the performance dramatically.
The next 3 steps are executed apart inside these regions which boosts the performance dramatically.
Step 2: Detect edgels in regions
Then a derivative of Gaussian is convolved on each scan line to estimate the component of the intensity gradient along the scanline.

This Gaussian derivative is used to detect black/white edges in the image. The Gaussian derivative is based on convolving the image with a small, separable, and integer valued filter in horizontal and vertical direction and is therefore relatively inexpensive in terms of computations. Local maxima along the scanlines stronger than a certain threshold (for all three color channels!) are considered to be edgels.
The Gaussian derivative kernel used, is given by:
[ -3 -5 0 5 3] * A
If an edgel is detected, the Sobel operator is used to determine the orientation of the edgel. The sobel operator is given by:

The orientation is then saved with the edgel. In the image above, the green dots are horizontal orientated edgels and the blue ones are vertical orientated edgels.
Step 3: Find segments in regions
After the detection of the edgels, a RANSAC-grouper algorithm is used to construct line segments in each region [2].

RANSAC is an abbreviation for “RANdom SAmple Consensus”. It’s an algorithm to find groups of “inliers”, i.e. points which can be fitted into a line.
The RANSAC algorithm in short:
- Randomly choose 2 points from the same region, whose orientations are compatible with the line joining the two points, to hypothesize a line.
- The number of points supporting each line is counted. To be considered part of a line an point must lie close to it and have a compatible orientation with the line.
- Steps 1 and 2 are repeated ~25 times before a segment is found.
- Lines with enough support (at least 4 segments) are considered detected lines. Steps 1 to 3 are repeated until all such lines have been found.
More about RANSAC: http://en.wikipedia.org/wiki/RANSAC.
Because we know the orientation of the edgels from step 2, we can give the linesegments an orientation. In the image above, the constructed segments are displayed as red and green arrows.
Step 4: Merge segments to lines
In this step the segments are merged to lines.

Two segments are merged if:
- The orientations are compatible.
- The segments are close to each other.
- If the pixels along the line between the two segments are on an edge, using the same edgel detection criteria as used in step 2.
First all segments are tested in their own region using this algorithm. When all possible segments are merged in their own region, the same operation is repeated for all segments in the whole image.
The merged lines are displayed as red/green arrows in the image above.
Step 5: Extend lines along edges
In this step the lines are extended along the edges.

Because we scan only pixels on scan lines 5 pixels apart, it’s inevitably that the merged lines don’t fit on the entire length of the edge of a marker. So in this step we extend the detected lines pixel by pixel until we detect a corner:
- Extend each end of a line and check if each pixel is on an edge, using the same edgel detection criteria as used in step 2. Do this until we hit a pixel that’s not an edge.
- Take a pixel a couple of pixels further. If this pixel is ‘white’, we might have a found a corner of a black on white marker.
The extended lines are displayed as yellow arrows in the image above. In step 6 and 7 only lines with at least one corner are used.
Step 6: Keep lines with corners
Keep the lines with corners.

Step 7: Find markers
Finally, we try to find all markers in the image.

To detect the markers in the image, we try to find chains of 3 to 4 lines. A chain is a list of lines where the end of one of the lines hits the start of another.
After finding such chains, we only want to keep chains which form a rectangle counter clock wise. These chains will have black ‘inside’ and are probably markers. Knowing the orientation of the lines, a cross product for each two successive line segments in a chain is used to check this condition.
After finding all markers, for each marker the 4 intersections of the lines in the chain are considered to be the corners. Calculating the positions of corners by these line-intersections gives a robust algorithm. Even if only 3 lines are detected and/or a corner is occluded, the marker will be correctly detected most of the time.
In the image above, all detected markers are displayed as red rectangles. Notice the correctly detected marker at the bottom of the image, although one edge is partially occluded by a pencil.
Now we have the coordinates of the detected markers. The next step would be to identify markers and distinguish them from each other in order to use this algorithm in an augmented reality application, but that will be a next blog :-)
Update: Marker detection in action
References
- Martin Hirzer, Marker Detection for Augmented Reality Applications, 2008.
- J.C. Clarke, S. Carlsson, and A. Zisserman. Detecting and tracking linear features efficiently, 1996.
Dowload related files:
Unseen AR Assignment
LAYAR is not yet working on my phone, so I have not been able to TEST my AR, but here is my site with BlueHost and FeedGeorge set -up, with geo-layer etc. http://therediscoveryproject.com/


Here are screenshots of my process - but Layar just gives me the spinning wheel. :(
Transparent picture of protesters at 6th Ave.


Display EPA's Website for "How you can Help!"

Option to watch Video of the March on 6th Ave

Here are screenshots of my process - but Layar just gives me the spinning wheel. :(
Transparent picture of protesters at 6th Ave.
Display EPA's Website for "How you can Help!"
Option to watch Video of the March on 6th Ave
Invitation: Attend virtual AR Community meeting on September 29
fwd:
I know that you are interested in topics pertaining to the future of Augmented Reality especially technologies and trends that will lead to open and interoperable AR. I would like to make sure that you are aware of upcoming activities to reduce barriers to open and interoperable AR.
If you did not receive a memo on Friday 19th September letting you know about the September 29 meeting then you are not already registered for the AR Community Announcements or Discussion mailing lists. You can find the paths to the registration pages for these (and other mailing lists) here: http://www.perey.com/
By being on these lists you will be informed when there are relevant discussions and announcements. I am the only one who posts on the announcements list and I always post the announcements to both lists. In the future I will assume that I do not need to send you a personalized memo such as this one to notify you of upcoming developments or meetings.
The draft Mixed and Augmented Reality Reference Model will be the topic of a special one hour virtual AR Community meeting (conducted by conference call and hosted by the IEEE Standards Association) on Monday, September 29 at 5 AM Eastern/11 AM Central European Time/6 PM Korean Time. This is an open meeting to which all AR Community members and the public are invited to participate using their Web browsers.
To learn more about speakers, topics and to request instructions to join the meeting, please visit:
http://www.perey.com/
Sunday, September 21, 2014
Yes We Can. But Should We? The unintended consequences of the maker movement
https://medium.com/re-form/just-because-you-can-doesnt-mean-you-should-252fdbcf76c8
Yes We Can.
But Should We?
The unintended consequences of the maker movement
"A 3D printer consumes about 50 to 100 times more electrical energy than injection molding to make an item of the same weight. On top of that, the emissions from desktop 3D printers are similar to burning a cigarette or cooking on a gas or electric stove. And the material of choice for all this new stuff we’re clamoring to make is overwhelmingly plastic. In a sense, it’s a reverse environmental offset, counteracting recent legislation to reduce plastic use through grocery bag bans and packaging redesigns. While more people tote reuasable cloth bags to the supermarket, plastic is piling up in other domains, from TechShop to Target."
/////////////////////////////////////////////////////
Last spring, I attended the Bloomberg BusinessWeek Design Conference in San Francisco. Ben Kaufman, the CEO of Quirky, was one of the speakers in a conference that unabashedly celebrated consumption (and only had three female speakers, but that’s another story). Kaufman went on at length about the dearth of products reaching the marketplace — and how his company was helping to remedy that. Patents were in the way, regulations were in the way, he went on, but Quirky was committed to getting products to market quickly, indeed twice weekly.
Quirky has been clever in melding the old-school notion of being an “inventor” with the new-school notion of being a “maker.” But somewhere in the course of entering the pop culture zeitgeist, the warm and fuzzy self-empowered “maker” idea got turned into an engine for output and profit. No idea is too superfluous. Many of the items the company sells are gadgets like “Pivot Power,” designed expressly for plugging in other gadgets. It felt to me that the very purpose of Kaufman’s endeavor was to get more stuff on shelves, or what he referred to as “social product development.”
Not so long ago it felt like we were beginning to recognize that as a society, our patterns of production and consumption were not sustainable. Messages like The Story of Stuff went viral, refocusing our collective eyes on our culture’s stunning material wastefulness. But that period was short, and the resolve for change it seemed to herald has all but evaporated. While many innovative companies have been focusing on selling experiences rather than manufacturing goods, the drive to produce more has only accelerated.
Technology has become not only more sophisticated, but access to its bells and whistles has become relatively more affordable and accessible. With this, ideas around designing and making have shifted and sectors of the maker movement have veered from basement workshop projects to the production of i-accessories and other trinkets that make Kickstarter fanboys drool. Just as desktop publishing tools made everyone [think they were] a graphic designer, 3-D printers and the like have empowered legions to be the next Jony Ive. (Not incidentally, why must every last bit of product design be measured by whether it would make Ive proud?)
I won’t point the finger at one company or one discipline but I am struck by the absence of sustainable discourse in the maker movement. Daily, we read swooning odes to the 3-D printer, the CNC router and other cutting edge manufacturing technologies but read almost nothing that approaches these developments through a much-needed critical lens. Every tchotchke is celebrated as if it were as significant as the wheel or the printing press.
In Japanese culture, there is a word for this: chindogu. The literal translation is “weird tool,” but the concept is about utility, or lack thereof.Kenji Kawakami coined the term as a way to point out objects that are invented under the premise of solving a problem, but which, in practice, only generate more problems, rendering them devoid of utility. Kawakami humorously calls them “unuseless,” which is to say, they have a function, it’s just not one that helps us (and it may be one that harms us).
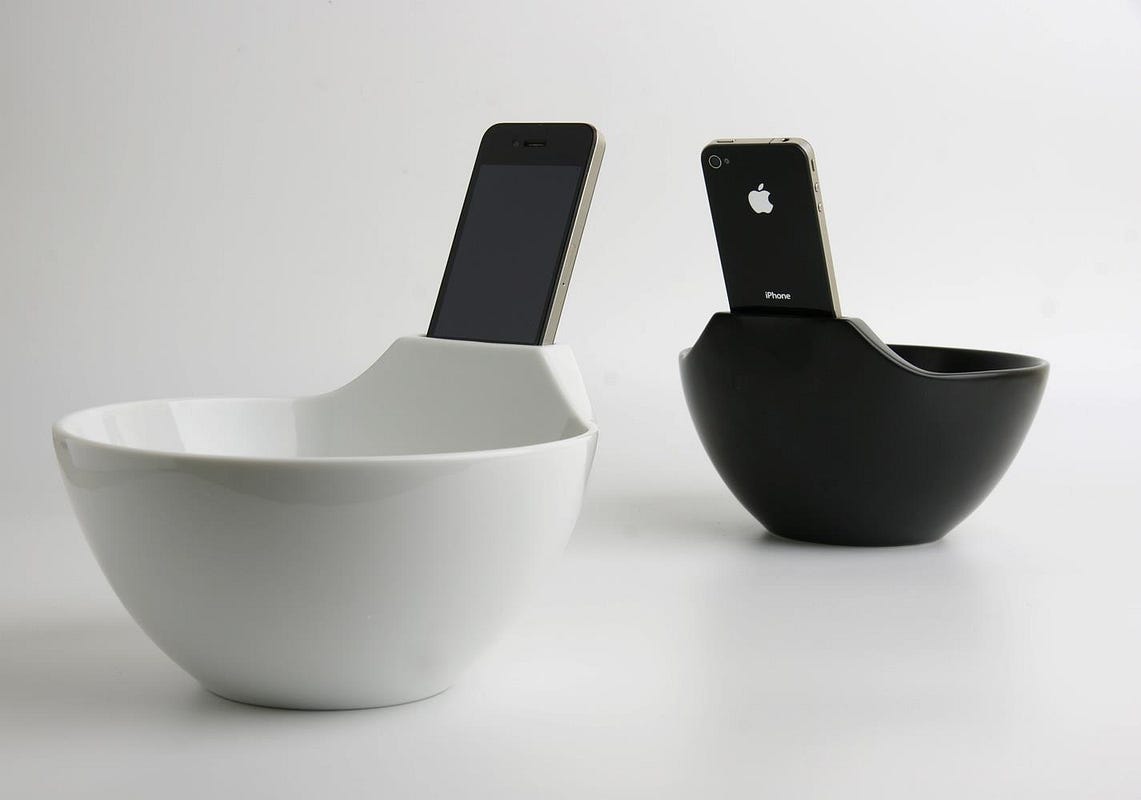
Day after day I read glowing “stories” (aka slightly modified press releases) on egregious products like the Anti-Loneliness Ramen Bowl, a gadget designed to hold your soup and prop up your iPhone. As artistic commentary on our current cultural condition, such an object is worthy. It points to our round-the-clock addiction to connectivity, our intimate relationship with gadgets, our increasing physical isolation. But the highest purpose of such an object is in the statement it makes, not in being manufactured for all the world’s kitchen cabinets. In the internet age, a good concept object can be made once, spread widely, and never mass-produced.
Maker-inspired initiatives are creeping into the corporate sphere, as well. Earlier this year, Hershey’s (of all companies) showed up at the Consumer Electronics Show with an announcement about their quest to make a 3D-printer for chocolate. For the company, this big trade-show reveal signaled how innovative and on-trend they are. But does every home need an additional printer exclusively for on-demand chocolate bars? The degree of additional energy and material output required to bring this concept to reality is almost unfathomable.
In Why Things Bite Back, Edward Tenner writes of what he calls the “ironic unintended consequences’’ of human ingenuity, ranging from antibiotics that promise the cure of disease but end up breeding resistant microorganisms, to a new football helmet, designed to reduce injuries, that actually encourages a more violent style of playing, thus creating the risk of more serious injury. We’re experiencing some of these ironies now as we use technology to solve the wrong problems. We’re in a period where almost anyone has the tools to make almost anything – but are we making the right things? Or too many of the wrong ones?
There seems to be a misconception about what 3D printing does and does not enable. Does it allow us to delight a four-year-old by pulling a mini Darth Vader toy seemingly out of thin air? It does. But the object doesn’t materialize from nothing. A 3D printer consumes about 50 to 100 timesmore electrical energy than injection molding to make an item of the same weight. On top of that, the emissions from desktop 3D printers are similar to burning a cigarette or cooking on a gas or electric stove. And the material of choice for all this new stuff we’re clamoring to make is overwhelmingly plastic. In a sense, it’s a reverse environmental offset, counteracting recent legislation to reduce plastic use through grocery bag bans and packaging redesigns. While more people tote reuasable cloth bags to the supermarket, plastic is piling up in other domains, from TechShop to Target.
For the world of design and maker culture, it’s Karim Rashid all over again, just in white t-shirts instead of white suits.
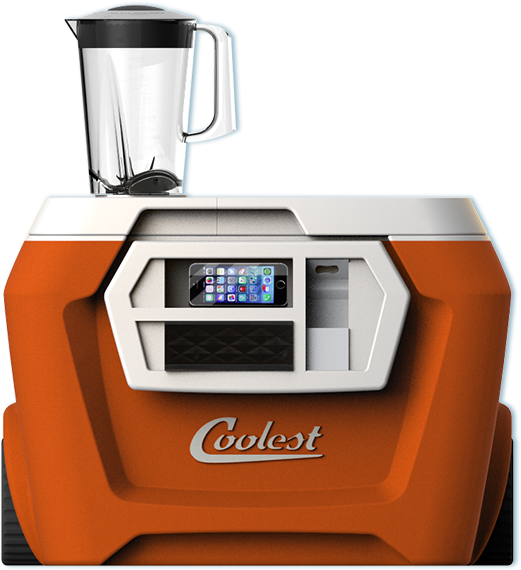
Good design is often defined as being an elegant solution to a clear problem. Perhaps we’re solving the wrong problems — or inventing problems that don’t exist — as justification for our excessive output. Do we need more products? Not really. But we need better ones. So why aren’t we designing them? Why are we reading about so many bad ones? Why, for example, did more than 62,000 people recently pitch in to fund a new drink cooler that doubles as a beverage blender (and triples as a stereo) to the tune of$13,285,226?
This is not to say that there aren’t good things happening in the maker space, things that run the gamut from the attractive and functional Floyd Leg, which turns any flat object into a sturdy table; to endeavors like Repair-Ware and i-Fixit, which attack planned obsolescence head-on; to a place likeThe Tinkering School, which encourages kids to make stuff for the sake of making it (they then disassemble what they’ve created and reuse the materials). We need these avenues for supporting craft and DIY, developing an alternative to consumerism rather than a direct line to it.
Saturday, September 20, 2014
Friday, September 19, 2014
Reminder --- MAKER FAIRE Sept 20 -21
a bunch of my friends will be showing here - great to get ideas
|

|
|

|
|

|
|

|
3d models with Layar
If you want to load 3d models with Layar you need to use the l3d converter.
Download it here
How to Use 3D Model Converter
In this section, we will walk you through each main feature mentioned above and explain how you can use Layar3D Model Converter.
Step 1: Importing Wavefront (.obj/.mtl)
After launching the Layar3D Model Converter, you first have to load the model you want to convert to Layar3D. Select "File -> Import Wavefront (.obj/.mtl)". Please see Creating the 3D objects to learn how to create a good 3D model for displaying in Layar. You can also open a .l3d file directly (Select "File ->Open").

Step 2: Inspect model
When you have loaded the model, you will see an overview of the model, including details about the number of verticex, faces, and materials. Also a list of the model dimensions is shown. The minimum Layar version shows you for which layar client version this 3D model is supported. Please NOTE that if there is Opacity value in imported .obj/.mtl files, the minimum layar client version will be automatically set to layar version 6.0 +.

Step 3: Edit materials (optional)
On the 'Materials' tab, you can:
- View the material names used in .obj/.mtl files.
- Edit material colors, shininess and opacity values. Material transparency is supported and can be manipulated using the Opacity value. The Opacity value embedded in .obj/.mtl files will be prefilled if it is present. By default, the value is 1.
- Enable / disable color blending. when blending is enabled, it means that color value of this material is blended with the color of any other objects that are rendered behind it. If it is disabled, it means the objects that are rendered behind it are hidden from view.
- Edit "Shader" field with two options - default & nolighting. The "nolighting" option is for people who want to bake lighting effects into textures instead of relying on the standard lighting from the AR view.
- Add and edit textures used in the model.
- Replace a texture by clicking on the "Replace image" button.

Step 4: Add texture animation (optional)
Under the "Materials" tab, you can enable texture animation by changing the "Type" value to "animated". This will allow you to add animation frames to the texture. Please check Create texture-animated 3D models to learn how to created texture animated 3D model.

Step 5: Preview the model in 3D (optional)
To save time with testing in the Layar browser, you can use the "Preview" tab to see how the model will look in Layar. This preview window allows you to view the model from different distances and angles.

Step 6: Edit the model to fix any normal, positioning, or scaling issues (optional)
Use the edit menu to manipulate the model and to optimize it display in Layar.
- Drop normals - causes the client to to calculate smooth vertex normals by using the average of the normals of all faces that the vertex is part of.
- Calculate face normals - causes the vertices to have the normals of the faces they are part of. This results in hard edges.
- Flip faces - changes the vertex order of each face, which turns the model "inside out".
- Optimize materials - reorders the faces to be sorted by material. This improves rendering speeds.
- Rotate - Rotate the model around X axis by 90 or -90 degrees. This will change the direction where the model itself is facing.
- Scale - Resize the model by the specified factor. This will result in size change of the model itself.

Step 7: Layar3D placement on the map (optional)
Under "Placement" tab, you can place the 3D model directly on the map. A bird view of the model on the map is shown. The main functionality is:
- Locate the model by using the "search" function, such as "amsterdam".
- Single click on the map to get the geo-coordinates and place the model accordingly.
- Edit latitude, longitude, scale and angle factors and save the details in JSON format (while saving the model settings, a separate JSON file is created.)
For detailed explanation on how to use the Placement function, please check Positioning 3D Model within Layar3D Model Converter.

Step 8: Save as Layar3D (.l3d)
Select "File -> Save As..." to save your model to the Layar3D (.l3d) format. This will create a single file that contains the model including all textures. This is the file you need to refer to in your POI request response. Select "File -> Save" to update the existing Layar3D (.l3d) model.
It is also possible to save the same model for different layar version using "File -> Save for version". This is useful when you want to have your models work on various versions of layar clients. You can determine which 3d model should be returned in getPOIs response based on the "version" parameter in getPOIs request. Please NOTE that if you save the model for a specific older version, some features will be stripped from the model. For example, transparent materials might become opaque, and animated textures might be converted to a static version.

FeedGeorge Setup Tutorial
http://christen.community.uaf.edu/2013/02/18/collaborative-ar-platform/
Setting Up a Collaborative AR Platform with WordPress, FeedGeorge, and Layar
For this year’s ASTE session I’ve been looking into easy, inexpensive ways to build platforms that support collaborative, geotagged augmented reality projects. It is a mouthful to say it that way, but the important characteristics of these platforms is that they are easy for a relatively non-technical person to set up, that they support contributions from a group, and also store information about a topic that can be placed on a map and visualized using an augmented reality browser like Layar. These solutions must also be free (as in beer).
One such solution can be implemented using WordPress, a plugin called FeedGeorge, and Layar. To get started with these tools there is a bit of signing up and configuration that must be done at the beginning, but once things are set up, creating geotagged posts requires much less overhead. There are four primary steps that will get you started.
- Install & Configure FeedGeorge
- Create and configure a Layar layer
- Create your geolocated posts
- Test and Publish your layer
Install FeedGeorgeAR
The purpose of these instructions is to walk through the steps of installing and configuring the FeedGeorgeAR plugin, setting up a new layer in Layar, and finally, geotagging your posts in WordPress so that they can appear in your Layar layer. After you’ve added all of your POIs (points of interest) as WordPress posts, you will be able to test your Layar layer and submit it to be published for the public.
1. To get started, click on Plugins, then click on the “Add New” link and search for FeedGeorge. You will see to plugins in the search result. Install FeedGeorge Augmented Reality plugin. Activate the plugin.

2. After the plugin is activated, go to FG Augmented Reality -> Settings, which you will find in the bottom of the left sidebar. Here you will see red text at the top of the page, informing you that you must get an API Key to run FeedGeorge. No problem! Simply follow the link provided.

3. A window will pop up, prompting you to sign up for the FeedGeorge API. Fill out the remainder of the form. Your web site should already be filled in for you. Click the “Sign Up” button when you have finished.
4. A small window should popup with an API Key for you to copy. Copy the key text.

4. A small window should popup with an API Key for you to copy. Copy the key text.
Back in WordPress, paste the API Key text you just copied into the FeedGeorge API Key box (under the red text), then “Update Options”.

5. Now You need to create a new layer, which is where you will post your POIs, in the Geolocation Layer screen. Click the “Geolocation Layer” link in the left sidebar to get there.
Type a layer name in the box, select the radius you want to cover, then click the “Add New Layer” button. (Search radius: Far: <2,000 meters; Medium: <500 meters; Near: <10 meters)

Create and Configure Your Layer in Layar
1. Go to the Layar web site and login in (assuming you have already created a developer account with them).

2. Once logged in, follow the “My Layers” button in the upper-right corner of the window.

3. Create a new layer by clicking the “Create a new layer” button.


- Layer name: Must be all lowercase, start with a letter, be unique, and may contain numbers, but no spaces or special characters. This cannot be changed
- Title: Can only be 18 characters long
- Short description: A 60-character description. This appears as the layer title in Layar
- Publisher name: This appears as the content publisher/owner in the Layar catalog
- API endpoint URL: This is why you just copied from the WordPress plugin.
- Layer Type: Generic 2D
- Layar Vision: Do not enable
Click “Create Layer” when you’re finished filling out the information for your layer.
4. Layering & Indexing: Create Thumbnails for your layer. They appear in search results and in the app. More attractive-looking buttons mean users will be more likely to click into your layer.
Complete the rest of the information about your layer. Adding a long description and keywords will help make your layer more findable in search.
Change your layer to the latest version of Layar.

5. Look & Feel: Use the example linked in the upper-right corner to see exactly where the custom banners and colors will appear in your layer.


6. Set the Coverage area: After selecting the appropriate country, be sure and left-click (PC), or Command-click (Mac) to create your bounding boxes – if you do not, the boxes will not persist when you click “Save”. Just click, do not click + drag. You may have to wait for a few moments for a box to appear.

7. Filters: The filter values will almost always need to be increased. These values influence success of your POIs during testing. If your POIs do not return, increase the values.

8. Permissions: Set the publisher of your layer.

9. Additional Settings: Feel free to experiment with these. The “Take me there” option is very handy to have in-app.

That’s enough configuring of your layer for now. Let’s go back to your WordPress Dashboard.
Create Your Geolocated Posts
Now, you are ready to begin creating geolocated posts. These posts will contain the POIS (points of interest) that will appear in Layar. You can configure what sort of information you would like to associate with each POI in the Edit Post screen.
The first post is the hardest. I promise it gets easier!
1. Create a new post by going to Post ->Add New in the left sidebar of the WordPress Dashboard.

2. Items to specify in your post (see list below the following diagram):

- Give your post a title
- Add any post content you want to accompany the post on the site. This field will not be used for the Layar layer.
- Create a new category for your layer and select it.
- Create a tag for your layer
- Drop down the “Select layer” options and select the title of your AR layer (this is used in Layar)
- Select “Geolocation” to set lat/long coordinates for your post (this is used in Layar)
- Type the address closest to the location you want to tag.
- Drag/drop the marker once it is near the location. This creates the exact lat/long coordinates used in Layar.
- Set a Featured Image
3. Click on the “Action” tab under Layar POI.
You can add actions for this content that will be available in Layar – for example:
(a) Link to other website
(b) Link to another layer
(c) Make a call
(d) Send an email
(e) Send a SMS
(a) Link to other website
(b) Link to another layer
(c) Make a call
(d) Send an email
(e) Send a SMS

4. On the 2D/3D Images tab you can replace the default “marker” with a 2D image by uploading image file (not more than mobile device’s screen size – e.g. 300×450 pixels). It’s optional to change the Size if the image is too big for the screen.

5. The last step is to add audio or video files to the content. There are two options for uploading the media
- Upload audio or video file from computer
- Insert Youtube video.
Insert YouTube video
Click on “Insert YouTube Video” button. Copy and paste YouTube video URL (e.g. http://www.youtube.com/watch?v=20gkvAAwUag) in the form provided (make sure your URL isn’t HTTPS).
Click on “Add” button before “Update/Publish” the post.

6. Publish your post and continue creating posts to set your POIs.
Test Your Layer in Layar
After you’ve configured your new layer in Layar and made a few POIs on your WordPress site, you can start testing your Layar layer and request to be published so that anyone can view your POIs in Layar.
Testing your layer first helps to ensure your POIs are reaching Layar properly so that Layar publishes your layer faster.
Subscribe to:
Posts (Atom)